
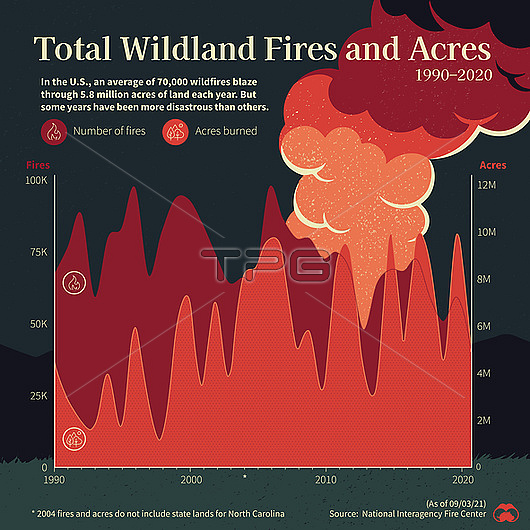
Infographic graph depicting the number of wildfires (dark red) and the size of land burned (orange) in the USA each year between 1990 and 2020. On average there are 70,000 wildfires in the US that burn through 5.8 million acres of land each year. This graph reveals how some years are worse affected than others. The worst year for numbers of wildfires was in 2006 which had over 96,000. The worst year for land burned was 2015 which had over 10.1 million acres destroyed by wildfires. source: National Interagency Fire Centre 2021.
| px | px | dpi | = | cm | x | cm | = | MB |
Details
Creative#:
TPG33842894
Source:
達志影像
Authorization Type:
RF
Release Information:
須由TPG 完整授權
Model Release:
n/a
Property Release:
n/a
Right to Privacy:
No
Same folder images:
 Loading