
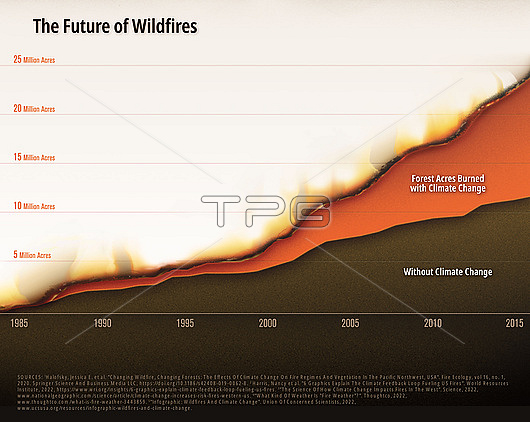
Graph depicting the cumulative acres of burned forest area. While the data is only collected up until 2015, current trends show that contributions from climate change-induced wildfires are continuing to increase year after year.
| px | px | dpi | = | cm | x | cm | = | MB |
Details
Creative#:
TPG33842821
Source:
達志影像
Authorization Type:
RF
Release Information:
須由TPG 完整授權
Model Release:
n/a
Property Release:
n/a
Right to Privacy:
No
Same folder images:
illustrationartworkcgidigitally-generatednobodyno-onetextdatainfographicinfographicalchartgraphglobalwarminggreenhousegascarbonemissionemissionscarbondioxideco2pollutionenvironmentenergyburningfossilfuelscarbonclimatechangefirefireswildfirestinderboxeffecthotheatforestfirefeedbackloopfeedbackmechanismbushfire
artworkburningbushfirecarboncarboncarboncgichangechartclimateco2datadigitally-generateddioxideeffectemissionemissionsenergyenvironmentfeedbackfeedbackfirefirefiresforestfossilfuelsgasglobalgraphgreenhouseheathotillustrationinfographicinfographicalloopmechanismno-onenobodypollutiontexttinderboxwarmingwildfires
 Loading