
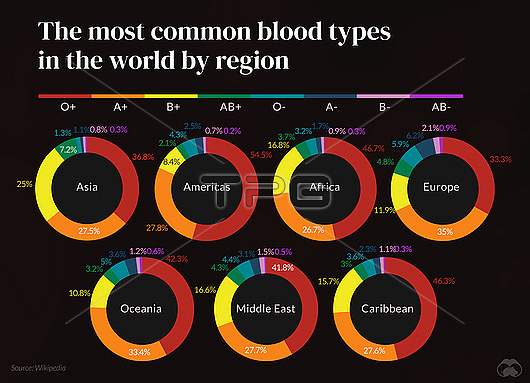
Infographic illustration depicting the distribution of blood types around the world by region. The maps show that O+ (red) is the most dominant blood type across the globe but the proportion of other blood types vary by region. Asia has a higher percentage of people with blood group B-positive compared to other regions, while in Europe, A-positive is more dominant. Blood types are determined by the presence or absence of certain antigens.
| px | px | dpi | = | cm | x | cm | = | MB |
Details
Creative#:
TPG33842811
Source:
達志影像
Authorization Type:
RF
Release Information:
須由TPG 完整授權
Model Release:
n/a
Property Release:
n/a
Right to Privacy:
No
Same folder images:
illustrationartworkcgidigitally-generatednobodyno-onetextdatavisualizationvisualisationdatainfographicinfographicalchartgraphmapbloodbloodtypeantigenbloodgrouphaematologicalhaematologyhematologymedicalmedicinetypeA+a-positiveb-positivea-negativeb-negativeo-positivetypeO+typeB+geneticsinheritedrhfactorpopulation
A+B+O+a-negativea-positiveantigenartworkb-negativeb-positivebloodbloodbloodcgichartdatadatadigitally-generatedfactorgeneticsgraphgrouphaematologicalhaematologyhematologyillustrationinfographicinfographicalinheritedmapmedicalmedicineno-onenobodyo-positivepopulationrhtexttypetypetypetypevisualisationvisualization
 Loading