
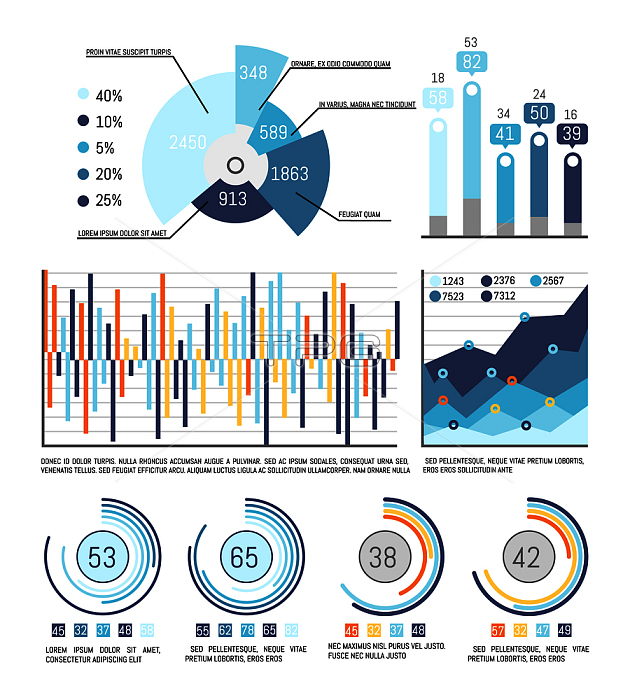
Pie diagram with percentage and infographics vector. Infochart and flowcharts with numeric information of analyzed issue. Statistics on charts graphs. Pie Diagram with Percentage and Infographics
| px | px | dpi | = | cm | x | cm | = | MB |
Details
Creative#:
TPG31176564
Source:
達志影像
Authorization Type:
RF
Release Information:
須由TPG 完整授權
Model Release:
No
Property Release:
No
Right to Privacy:
No
Same folder images:
Restriction:
eps檔
piediagrampercentinfographicsvectorpercentageinfographicinfochartflowchartchartgraphgraphicschemedesigntemplatecirclepresentationdatalayoutstatisticvisualizationillustrationsignstructureplanningexamineinfographrateprojectsearchplanresearchflowinvestigatefigureexplorebartableeditablereportstrategyinfolineinformationanalyzevisualorganizationnumberideaflatPiediagramwithpercentageandinfographicsvector.Infochartandflowchartswithnumericinformationofanalyzedissue.Statisticsonchartsgraphs.PieDiagramwithPercentageandInfographicsING_47129_49558.jpgooopicapiimagedjapiguaranaapi
DiagramING_47129_49558.jpgInfochartInfographicsPercentagePiePieStatisticsanalyzeanalyzedandandandbarchartchartscircledatadesigndiagramdiagrameditableexamineexplorefigureflatflowflowchartflowchartsgraphgraphicgraphs.guaranaapiideaillustrationimagedjapiinfoinfochartinfographinfographicinfographicsinfographicsinformationinformationinvestigateissue.layoutlinenumbernumericofonooopicapiorganizationpercentpercentagepercentagepieplanplanningpresentationprojectratereportresearchschemesearchsignstatisticstrategystructuretabletemplatevectorvector.visualvisualizationwithwithwith
 Loading