
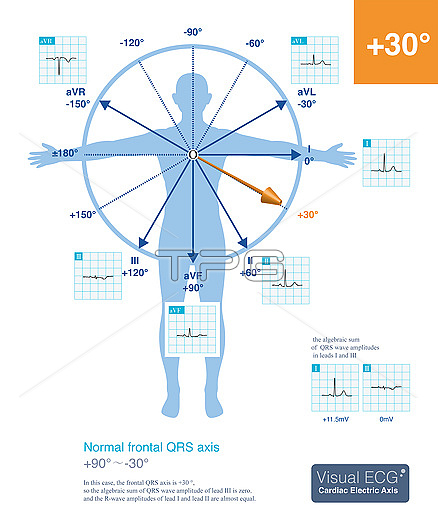
Electrocardiogram (ECG) illustration showing a normal QRS axis. The normal frontal QRS axis distribution range is +90 degrees to approximately -30 degrees. This case is +30 degrees, a normal ECG axis. The R-wave amplitudes of lead I and lead II are almost equal.
| px | px | dpi | = | cm | x | cm | = | MB |
Details
Creative#:
TOP26665028
Source:
達志影像
Authorization Type:
RM
Release Information:
須由TPG 完整授權
Model Release:
N/A
Property Release:
N/A
Right to Privacy:
No
Same folder images:
artworkcardiologyelectrophysiologycardiacheartillustrationdigitallygeneratednobodyno-onemedicinemedicalhealthcareECGmalesinusrhythmnormalECGaVLleadQRSwavePwaveSTsegmentTwavePRintervalfrontalleadsystemlimbleadcardiacelectricaxisQRSaxisnormalelectricaxisrightaxisdeviationleftaxisdeviationextremerightaxisdeviationmaximumQRSvector
ECGECGPPRQRSQRSQRSSTTaVLartworkaxisaxisaxisaxisaxisaxiscardiaccardiaccardiologydeviationdeviationdeviationdigitallyelectricelectricelectrophysiologyextremefrontalgeneratedhealthcareheartillustrationintervalleadleadleadleftlimbmalemaximummedicalmedicineno-onenobodynormalnormalrhythmrightrightsegmentsinussystemvectorwavewavewave
 Loading