
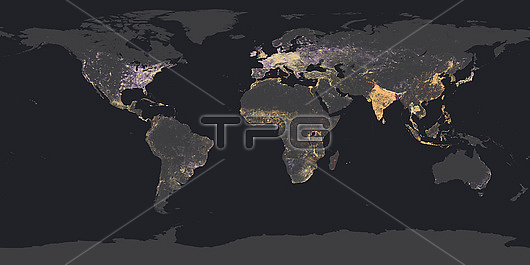
Colour-coded map showing the variation in population density around the world in 2016. Rural areas, with upto 100 people per square kilometre (km), are light purple. Settled areas, with up to 400 per square km. are dark purple. Urban areas. with up to 1,908 people per square km. are brown. Heavy urban areas. with up to 16,978 people per square km. are orange. Extreme urban areas. with up to 26,331 people per square km. are red.
| px | px | dpi | = | cm | x | cm | = | MB |
Details
Creative#:
TOP25842165
Source:
達志影像
Authorization Type:
RM
Release Information:
須由TPG 完整授權
Model Release:
N/A
Property Release:
N/A
Right to Privacy:
No
Same folder images:
 Loading