
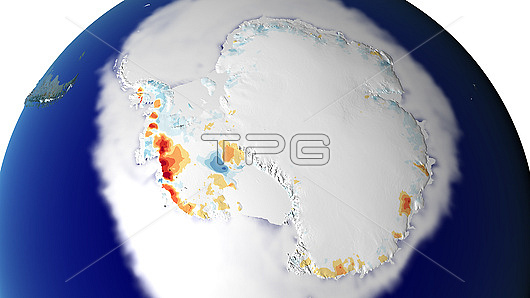
Twenty-five years of Antarctic ice loss, 1993 to 2018. Map of the southern polar continent of Antarctica, with ice loss shown as colour-coding for land ice elevation change. Areas in red indicate land ice loss. Areas in blue are regions that saw land ice elevation gains over the 25-year period. The data was collected as part of the NASA's Measures (Making Earth Science Data Records for Use in Research Environments) programme, specifically the ITS LIVE (Inter-Mission Time Series of Land Ice Velocity and Elevation) project. Image published in 2019.
| px | px | dpi | = | cm | x | cm | = | MB |
Details
Creative#:
TOP25529452
Source:
達志影像
Authorization Type:
RM
Release Information:
須由TPG 完整授權
Model Release:
N/A
Property Release:
N/A
Right to Privacy:
No
Same folder images:
CLIMATECHANGECLIMATOLOGICALGLOBALWARMINGNO-ONENOBODYANTARCTICTIMELINETRENDCHANGECHANGESTRENDSICEELEVATIONGAINLOSSCOLDICYFROZENPOLARSOUTHERNMEASURESMAKINGEARTHSCIENCEDATARECORDSFORUSEINRESEARCHENVIRONMENTSITSLIVEINTER-MISSIONTIMESERIESOFLANDICEVELOCITYANDELEVATIONWHITEBACKGROUNDGEOGRAPHICALHISTORICAL1900SICELOSSCONTINENTICEICESHEETANTARCTICACLIMATOLOGYEARTHSCIENCESPHYSICALGEOGRAPHYGLACIOLOGYEARTHOBSERVATIONHISTORYMODELMAP20THCENTURY21STCENTURY19932018
1900S1993201820TH21STANDANTARCTICBACKGROUNDCENTURYCENTURYCHANGECHANGECHANGESCLIMATECLIMATOLOGICALCLIMATOLOGYCOLDCONTINENTDATAEARTHEARTHEARTHELEVATIONELEVATIONENVIRONMENTSFORFROZENGAINGEOGRAPHICALGEOGRAPHYGLACIOLOGYGLOBALHISTORICALHISTORYICEICEICEICEICEICYININTER-MISSIONITSLANDLIVELOSSLOSSMAKINGMAPMEASURESMODELNO-ONENOBODYOBSERVATIONOFPHYSICALPOLARRECORDSRESEARCHSCIENCESCIENCESSERIESSHEETANTARCTICASOUTHERNTIMETIMELINETRENDTRENDSUSEVELOCITYWARMINGWHITE
 Loading