
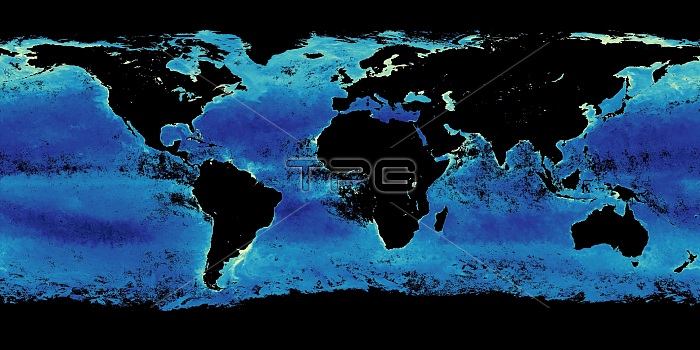
Global chlorophyll levels, September 2014. Global satellite map showing average chlorophyll levels in the Earth's oceans during the month of September 2014. The ocean colours show concentration of chlorophyll (due to phytoplankton blooms) in milligrams per cubic metre, from low levels (dark blue, 0.01) to high levels (light green, 30 to 60). Blooms are seen mostly in coastal waters and in the Arctic and Antarctic. The chlorophyll data was obtained by the MODIS (Moderate-resolution Imaging Spectroradiometer) sensor on NASA's Aqua satellite. Black areas show where the satellite could not measure phytoplankton.
| px | px | dpi | = | cm | x | cm | = | MB |
Details
Creative#:
TOP16633908
Source:
達志影像
Authorization Type:
RM
Release Information:
須由TPG 完整授權
Model Release:
N/A
Property Release:
N/A
Right to Privacy:
No
Same folder images:
 Loading