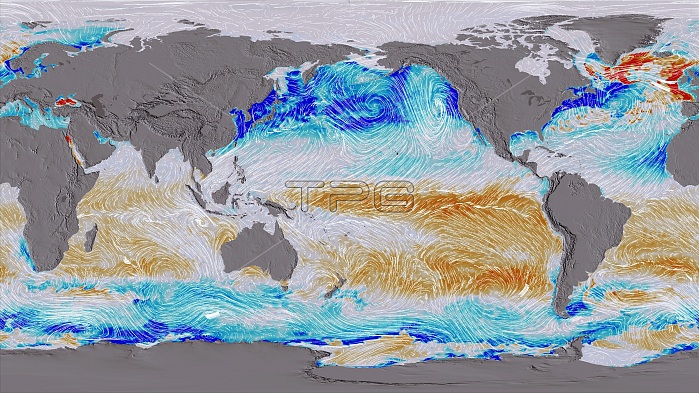
Ocean surface CO2 and winds, global map. This map, centred on the Pacific Ocean, is from an animation that shows the ocean surface carbon dioxide (CO2) flux in 2009 and 2010. Blue colours indicate uptake and orange-red colours indicate out-gassing of ocean carbon. The pathlines indicate surface wind stress, one of the drivers of air-sea carbon exchange. Studying this process aids understanding of the carbon cycle, carbon biogeochemistry, and climate change. These results are from the ECCO2-Darwin ocean carbon cycle model, part of NASA's Carbon Monitoring System (CMS) Flux Project. This image shows data from 1 March 2009.
| px | px | dpi | = | cm | x | cm | = | MB |
Details
Creative#:
TOP16085299
Source:
達志影像
Authorization Type:
RM
Release Information:
須由TPG 完整授權
Model Release:
N/A
Property Release:
N/A
Right to Privacy:
No
Same folder images:

 Loading