
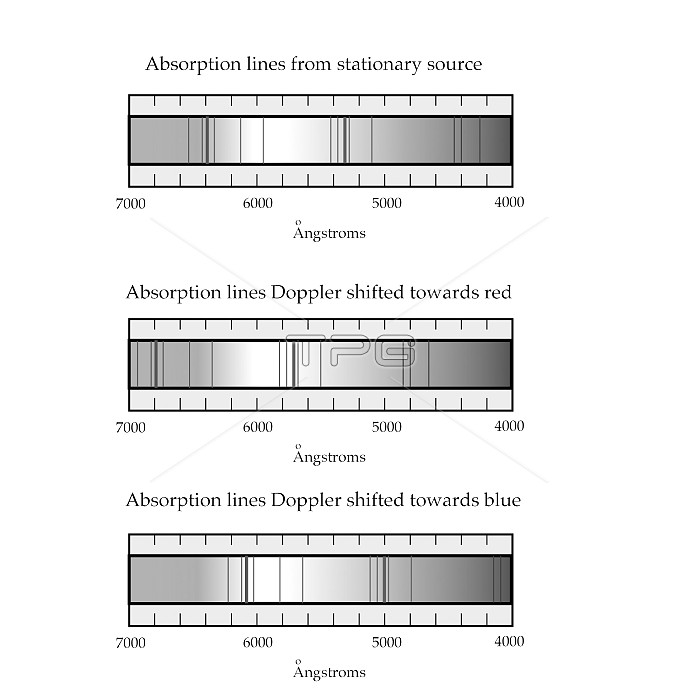
Doppler shift of spectral lines. Diagram of three spectra with the changing positions of absorption lines (dark bars) in light from stationary (top), receding (centre) and approaching (lower) stars. The spectra show the wavelength range over the visible part of the electromagnetic spectrum, from red (7000 Angstroms) to blue (4000 Angstroms). The absorption lines are red-shifted for objects that are receding and blue-shifted for objects that are approaching. The effect, noticeable when the speed is comparable to that of light, is used to measure the recession speeds of distant galaxies, and help calculate the age of the universe.
| px | px | dpi | = | cm | x | cm | = | MB |
Details
Creative#:
TOP10241491
Source:
達志影像
Authorization Type:
RM
Release Information:
須由TPG 完整授權
Model Release:
N/A
Property Release:
N/A
Right to Privacy:
No
Same folder images:
 Loading