
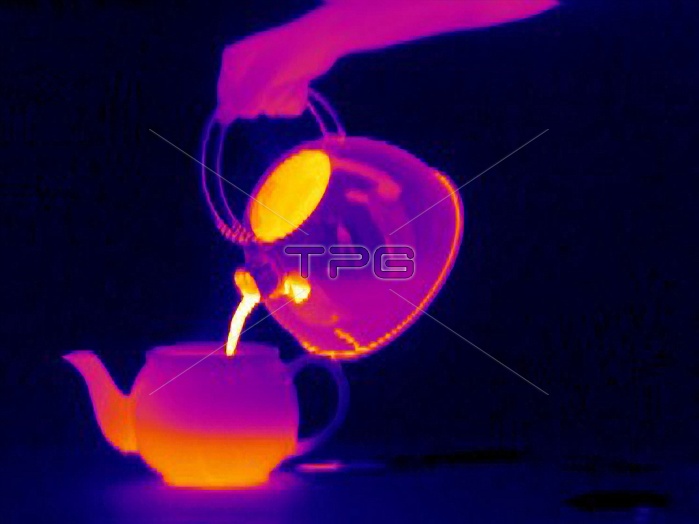
Making a cup of tea. Image 2 of 4. Thermogram of a hand pouring boiling water from a kettle into a pot to make tea. The colours show variations in temperature. The scale runs from white (warmest), through yellow, orange, red and purple to blue (coldest). Thermography records the temperature of surfaces by detecting long-wavelength infrared radiation. The heat of the boiling water is seen as it fills the teapot, but less heat is lost than is seen escaping from the open lid of the kettle. The handles remain cool due to the little contact they have with the hot surfaces. For a sequence of thermograms showing a cup of tea being made, see images H584/103-106.
| px | px | dpi | = | cm | x | cm | = | MB |
Details
Creative#:
TOP10193985
Source:
達志影像
Authorization Type:
RM
Release Information:
須由TPG 完整授權
Model Release:
N/A
Property Release:
N/A
Right to Privacy:
No
Same folder images:
 Loading