
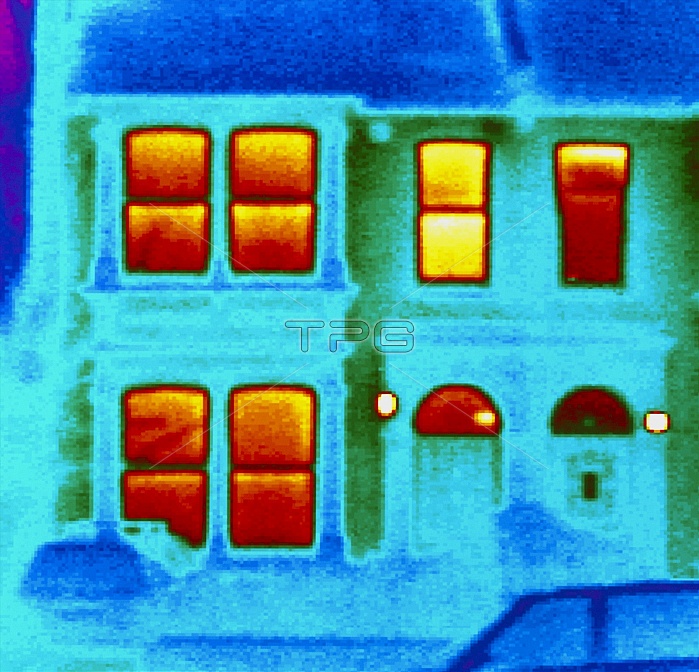
Heat loss. Thermogram of a house showing the distribution of heat over its surface. The temperature scale runs from red (warmest) through yellow, green, cyan and blue to mauve (coldest). Thermography is a technique for visualising the temperature of surfaces by recording their emission of long-wavelength variation. This heat radiation is detected electronically and displayed with different colours representing different temperatures. This thermogram shows that the roof is well insulated, while the walls and windows are losing the heat. Thermograms are used to check houses for heat loss, so their heat insulation can be improved.
| px | px | dpi | = | cm | x | cm | = | MB |
Details
Creative#:
TOP10193966
Source:
達志影像
Authorization Type:
RM
Release Information:
須由TPG 完整授權
Model Release:
N/A
Property Release:
N/A
Right to Privacy:
No
Same folder images:
 Loading