
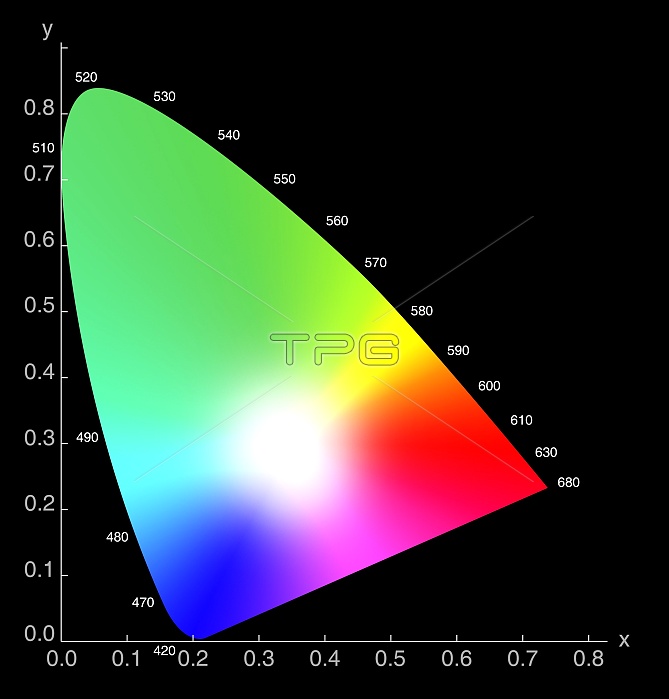
CIE chromaticity diagram. This diagram (developed in 1931) shows all the colours that can be perceived by the normal human eye, and is the international standard for defining colours. The colours are defined as a weighted sum of 3 primary colours, although in reality no 3 primary colours can combine to give all possible colours, so virtual primary colours are used. The curved edge of the plot corresponds to the colours of the visible spectrum (wavelengths are shown in nanometres), while the straight edge corresponds to non-spectral shades of purple. Pure colours are at the edges; as colours move towards the centre they become less saturated. White is at the centre of the diagram.
| px | px | dpi | = | cm | x | cm | = | MB |
Details
Creative#:
TOP10163233
Source:
達志影像
Authorization Type:
RM
Release Information:
須由TPG 完整授權
Model Release:
N/A
Property Release:
N/A
Right to Privacy:
No
Same folder images:
 Loading