
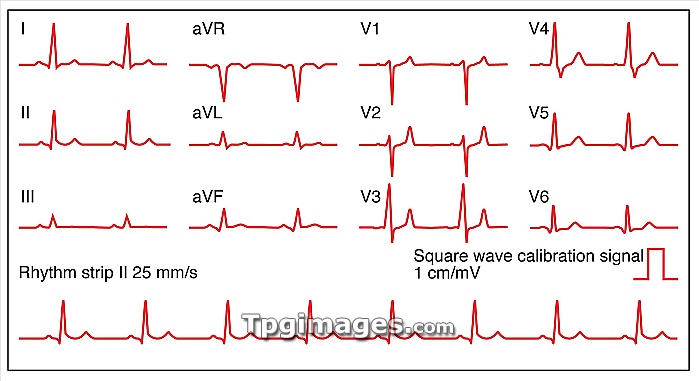
Electrocardiograms (ECG) of a normal heart rate, artwork. An ECG measures the electrical activity of the heart. The wave on the ECG appears upwards or downwards depending upon whether the electrical activity is going towards or away from the area of the body the electrode is placed on. This diagram shows 12 traces (or leads, upper 3 lines), which are obtained from placing 10 electrodes on the body, six on the chest and one on each arm and leg.
| px | px | dpi | = | cm | x | cm | = | MB |
Details
Creative#:
TOP07423515
Source:
達志影像
Authorization Type:
RM
Release Information:
須由TPG 完整授權
Model Release:
NO
Property Release:
NO
Right to Privacy:
No
Same folder images:
electrocardiogrammeasuringmedicinecardiologyartworkatrialconductioncontractiondepolarisationdepolarizationdiagnosisdiagnosticdownwardecgelectricalelectrocardiographelectrocardiographyhealthyheartbeatheartrateheartbeatillustrationlabeledlabelledlabelsmedicalnormalqrscomplexrepolarisationrepolarizationsignaltraceupwardventricularwave12lead12-leadtwelveleadtwelve-lead
1212-leadartworkatrialbeatcardiologycomplexconductioncontractiondepolarisationdepolarizationdiagnosisdiagnosticdownwardecgelectricalelectrocardiogramelectrocardiographelectrocardiographyhealthyheartheartheartbeatillustrationlabeledlabelledlabelsleadleadmeasuringmedicalmedicinenormalqrsraterepolarisationrepolarizationsignaltracetwelvetwelve-leadupwardventricularwave
 Loading