
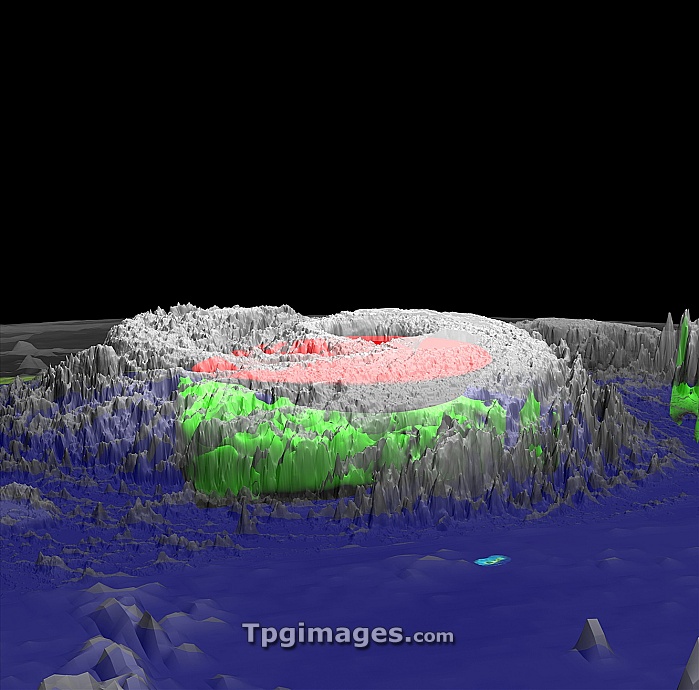
Hurricane Erin. 3-D computer image of Hurricane Erin on 10th September 2001. This image is composed of data from several instruments. Heat (red) was measured by the Convection and Moisture Experiment (CAMEX) aboard aircraft that flew over and around the hurricane. Rain intensity and distribution (green) was measured by the precipitation radar aboard the Tropical Rainfall Measuring Mission (TRMM) satellite. The clouds (middle top) were measured by infrared detectors aboard the Geostationary Operational Environmental Satellite (GOES)and TRMM. This data was processed by supercomputers at NASA to produce a 3-D animation.
| px | px | dpi | = | cm | x | cm | = | MB |
Details
Creative#:
TOP07420212
Source:
達志影像
Authorization Type:
RM
Release Information:
須由TPG 完整授權
Model Release:
NO
Property Release:
NO
Right to Privacy:
No
Same folder images:
 Loading