
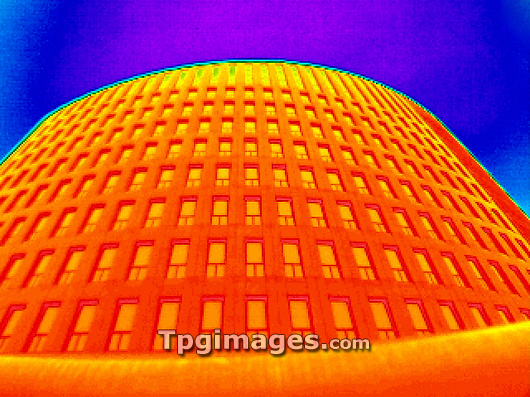
Office building, thermogram. A thermogram shows variation in temperature on the surface of an object, measured by the long-wave infrared radiation it emits. The temperature scale is colour-coded and runs from purple (coldest, -52 degrees Celsius) through blue, green and orange to red (warmest, 6 degrees Celsius). This imaging technique can be used to check the energy efficiency of buildings. The areas which appear hotter in a thermogram are where heat is being wasted.
| px | px | dpi | = | cm | x | cm | = | MB |
Details
Creative#:
TOP03228199
Source:
達志影像
Authorization Type:
RM
Release Information:
須由TPG 完整授權
Model Release:
N/A
Property Release:
N/A
Right to Privacy:
No
Same folder images:
 Loading