
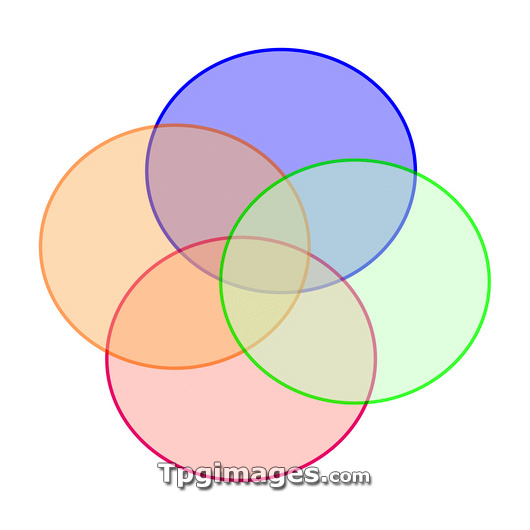
Venn diagram of intersecting circles. This diagram shows where four different sets (coloured blue, green, red and orange) overlap. Such Venn diagrams are named after the British logician John Venn (1834-1923). These diagrams are used in numerous mathemetical and scientific disciplines, such as set theory, probability theory, statistics and computer science.
| px | px | dpi | = | cm | x | cm | = | MB |
Details
Creative#:
TOP03198506
Source:
達志影像
Authorization Type:
RM
Release Information:
須由TPG 完整授權
Model Release:
N/A
Property Release:
N/A
Right to Privacy:
No
Same folder images:
 Loading